
Translate this page into:
Identification of novel somatic cell-free DNA variants by next-generation sequencing in breast cancer patients

*Corresponding author: Samson Mani, Department of Molecular Oncology, Cancer Institute WIA, Chennai - 600 036, Tamil Nadu, India. samsonn.m@gmail.com
-
Received: ,
Accepted: ,
How to cite this article: Raghu A, Balaiah M, Veluswami S, Sundersingh S, Thangarajan R, Mani S. Identification of novel somatic cell-free DNA variants by next-generation sequencing in breast cancer patients. Int J Mol Immuno Oncol 2021;6(1):16-26.
Abstract
Objectives:
Breast cancer is a heterogeneous disease affecting women worldwide and is one of the leading causes of mortality in India. Sampling bias due to tumor heterogeneity and invasive nature of biopsies necessitate noninvasive methods for comprehensive tumor profiling. Circulating cell-free DNA presents a complete mutation profile of the tumor, enabling the non-invasive monitoring of disease in real-time. This study aimed to identify tumor-specific variants in cfDNA with potential applications in the liquid-biopsy based testing of breast cancer.
Material and Methods:
Next-generation sequencing was performed for cell-free DNA, lymphocyte DNA, and tumor DNA from 21 breast cancer patients. Variant calling was performed using Torrent Suite Server v.5.0 and somatic variants were annotated using web-based tools. Pathogenic variants detected in cell-free DNA and tumor DNA of three patients were validated by Sanger sequencing.
Results:
Fifty-nine somatic variants were detected in the cell-free DNA of 10 breast cancer patients. Hotspot variants were detected in PIK3CA, TP53, and KRAS genes. In addition, previously unreported missense variants in ABL1 and PIK3CA genes were predicted to be pathogenic and potential driver mutations. Several frameshift indels were detected in two triple negative breast cancer patients.
Conclusion:
Sequencing of cell-free DNA from breast cancer patients identified somatic variants including several potentially pathogenic variants which have not been reported previously. These variants may have potential applications as non-invasive biomarkers for breast cancer.
Keywords
Cell-free DNA
Breast cancer
Somatic mutations
Liquid biopsy
Next-generation sequencing
Noninvasive biomarkers

INTRODUCTION
Breast cancer is a heterogeneous disease affecting women worldwide.[1] In India, breast cancer has surpassed cervical cancer to become the leading cause of cancer-related death, accounting for 14% of total cancer cases.[1,2] Ductal carcinoma (from cells lining milk ducts) or lobular carcinoma (from cells in lobules) are the commonly occurring subtypes of breast cancer. Based on the expression of estrogen receptor (ER), progesterone receptor (PR), and human epidermal growth factor receptor 2 (HER2) in breast cancer cells, breast cancer is classified into the following molecular subtypes – luminal A and B, HER2 overexpressed, basal, and normal-like.[3] In breast cancer, heterogeneity exists not only between tumors but also the cells of the same tumor. Cells of the same tumor differ at the level of cell differentiation, gene expression, mutation profile, and cell-cell interaction.[4] This intra-tumoral heterogeneity causes bias in sampling during tissue biopsy.[5] Further, other factors, namely, invasiveness of biopsy procedure, accessibility of tumors and cost, hinder the use of biopsies for prognosis, and evaluating treatment response.
Circulating cell-free DNA (cfDNA), being released into the bloodstream through tumor cell lysis or cell death, provides a non-invasive alternative for studying tumor genetic profile. Because of their origin from primary as well as metastatic tumors, they can present a comprehensive picture of the tumor genome.[6] Numerous studies have explored the potential of cfDNA as a non-invasive biomarker for breast cancer.[7-11] Furthermore, next-generation sequencing (NGS) allows profiling of multiple genes at once with high sensitivity, thereby allowing the detection of low-frequency variants. Use of NGS-based approaches in profiling cfDNA mutations has been evaluated in breast cancer patients. For example, Rothé et al. (2015) compared cfDNA mutations with those in matched tumor using the Ion Torrent platform and demonstrated the use of cfDNA as an alternative to tissue biopsy for metastatic lesions.[11] Masunaga et al. (2018) detected hotspot ESR1 mutations in cfDNA of metastatic breast cancer patients using molecular barcode sequencing and later designed a multiplex assay to detect mutations in the whole ligand binding domain of ESR1 in cell-free DNA.[12,13] Hence, NGS profiling of cfDNA can enable characterization of known and novel tumor mutations in a non-invasive manner, which can serve as a prognostic marker for breast cancer, enabling treatment monitoring, and management of breast cancer.[8-10] This study identified somatic mutations in cfDNA of breast cancer patients using NGS with potential applications in non-invasive diagnosis and prognosis of breast cancer.
MATERIAL AND METHODS
Study patients
Breast cancer patients (n = 21) were recruited for the study after obtaining signed informed consent. The institutional ethical committee approved ethical clearance. All procedures performed in this study were in accordance with the 1964 Helsinki Declaration and its later amendments or comparable ethical standards. The eligibility criteria for the patients were (a) histological confirmation of breast cancer, (b) patients included in chemotherapy +/- radiation therapy and hormonal therapy, and (c) informed consent to provide blood and tissue sample for the study. Patients unwilling to give informed consent and those with infectious or autoimmune diseases were excluded from the study.
Sample collection and processing
Five milliliters of peripheral blood were collected in EDTA coated tubes at presentation from breast cancer patients. The blood was processed within 2–4 h after collection. Plasma was isolated and centrifuged twice at 2000 g for 10 min to separate cellular content. The cell-free plasma was then stored in 1.5 ml Protein Lobind tubes (Eppendorf, Germany). Lymphocyte pellets from both centrifugation steps were resuspended in 0.5 ml PBS. Both cell-free plasma and lymphocytes were stored at −80°C until further use. Tumor tissue was collected during biopsy at presentation in the form of fresh-frozen tissue for five patients and as formalin-fixed paraffin-embedded (FFPE) sections for the remaining patients. Biopsy tissue was chosen as it was collected before treatment and would allow identification of tumor variants present at diagnosis.
DNA extraction and quantification
Cell-free DNA was extracted from 1 ml plasma using Qiagen Circulating Nucleic Acid Kit (Qiagen, Germany) as per the manufacturer’s instructions. Lymphocyte DNA and DNA from frozen tissue were extracted using Qiagen DNeasy Blood and Tissue Kit (Qiagen, Germany) as per the manufacturer’s instructions. DNA was extracted from FFPE sections using Roche High Pure FFPET DNA Isolation Kit (Roche, USA) as per the manufacturer’s protocol.
Qubit HsDNA assays kit was used for measuring DNA concentration (Life Technologies, USA). Qubit reagent was diluted in Qubit buffer in 1:200 ratio to prepare working solution. 1 μl of the sample was added to 199 μl of working solution and incubated for 2 min. The DNA concentration was then measured using Qubit fluorometer 2.0 (Life Technologies, USA).
NGS
Next-generation sequencing of cell-free, lymphocyte, and tumor DNA was performed using the Ion Personal Genome Machine™ (PGM™) System (Life Technologies, USA). Initial DNA concentration used was 10 ng. Ion Ampliseq Cancer Hotspot Panel v2 primer pool (Life Technologies, USA) was used for amplifying target regions of DNA. Ion Ampliseq Cancer Hotspot Panel v2 primer pool contains 207 primer pairs covering hotspot regions which are frequently mutated in 50 oncogenes and tumor suppressor genes. Raw data were obtained from the sequencing run using Ion torrent server. Read alignment and variant calling were performed using Torrent Suite Software v5.0 and Torrent Variant Caller plugin v.5.0 with default setting of somatic low stringency parameters. Variants detected in cell-free DNA and tumor DNA of each patient were compared to matched lymphocyte DNA to exclude germline variants and identify tumor-associated somatic variants. The somatic variants were annotated using CRAVAT tool.[14] In addition to variant ID, type and gene location, CRAVAT also annotated the variants with VEST[15,16] and CHASM[17] scores, which predicted the probability of the variant being pathogenic or a cancer driver mutation, respectively. MutationMapper tool, accessed through cBioPortal, was used to annotate the variants in protein coding regions, with details of variant location in protein, classification of variant as hotspot or actionable variants (information integrated by the tool from Cancer Hotspot and Oncokb).[18] MutationMapper also provided scores from functional impact prediction algorithms, MutationAssessor, SIFT, and PolyPhen-2. SIFT-INDEL was used to analyze the functional impact of frameshift indels.[19]
Mutation validation
Variants identified in cell-free DNA by Ion torrent platform were validated by Sanger sequencing. Briefly, PCR was performed for target regions in PIK3CA, STK11, and KRAS genes using Applied BioSystems 10X PCR buffer, MgCl2 and Taq DNA polymerase (Applied Biosystems, USA). PCR conditions used are as follows: Initial denaturation at 94°C for 10 min, 35 cycles of 94°C for 20 s, 52°C for 20 s, and 72°C for 45s, followed by 72°C for 10 min. The PCR products were purified by magnetic bead purification using Agencourt Ampure XP beads (Beckman Coulter Inc., USA). The purified PCR products were used as templates for cycle sequencing PCR which was performed using Applied Biosystems Big Dye Terminator kit (Applied Biosystems, USA). The sequencing PCR conditions were as follows: 96°C for 10 min, 25 cycles of 96°C for 10 s, 50°C for 5 s, and 60°C for 4 min. This was followed by capillary electrophoresis on Applied BioSystems 3500Dx Genetic Analyzer instrument (Applied Biosystems, USA). Sequences were read using Sequencing Analysis Software (Applied Biosystems, USA).
Statistical analysis
Statistical analyses were performed using GraphPad Prism v.8.0. Kruskal–Wallis test was used to compare cell-free DNA concentration between patients categorized by age, stage, HER2 scores, and subtypes. Mann–Whitney test was used to compare cfDNA concentration between hormone positive and hormone negative patients.
RESULTS
Characteristics of patients enrolled in the study and cfDNA concentration
Breast cancer patients (n = 21) with confirmed diagnosis of breast cancer were recruited for the study before treatment. The clinical and pathological characteristics of the patients are described in Table 1. The median age of the patients was 47 years (Range: 34–79 years). All patients except one were diagnosed with infiltrating ductal carcinoma. The patients include all stages of breast cancer except Stage 1. Twenty patients were categorized into luminal B (n = 10), triple-negative (n = 3), and HER2 amplified (n = 4) breast cancer. HER2 immunohistochemistry score was 2+ for three patients and was not confirmed by FISH. Hence, these patients are classified as ER+/HER2 2+ group. Hormone receptor status was unavailable for one patient. Concentration of cfDNA ranged from 6.15 to 540 ng/mL with a median of 30.9 ng/mL [Table 1]. No correlation was observed between cfDNA levels and age, stage, breast cancer subtype, and hormone status [Figure 1].
| Total no. of patients | 21 |
|---|---|
| Age | |
| Median | 47 |
| Range | 34–79 |
| Stage | |
| 2 | 7 |
| 3 | 7 |
| 4 | 7 |
| Histopathology | |
| Infiltrating ductal carcinoma | 20 |
| Invasive lobular carcinoma | 1 |
| Grade | |
| 2 | 1 |
| 3 | 20 |
| ER status | |
| ER negative | 7 |
| ER positive | 13 |
| Unknown | 1 |
| HER2 scores | |
| 0 or 1 | 3 |
| 2 | 3 |
| 3 | 14 |
| Unknown | 1 |
| Subtypes | |
| Luminal B | 10 |
| Triple-negative | 3 |
| HER2 amplified | 4 |
| ER/PR(+) HER2 (2+) | 3 |
| Unknown | 1 |
| Metastatic sites | 7 |
| Bone | 3 |
| Liver | 2 |
| Lung | 1 |
| SCL node | 1 |
| cfDNA concentration | |
| Median (ng/ml) | 30.9 |
| Range (ng/ml) | 6.15-540 |

- Correlation of cfDNA concentration with patient clinical features. The correlation was examined between cfDNA concentration and clinical features such as stage (a), age (b) breast cancer subtypes (c), and hormone status (d-f). Concentration is presented as mean±SEM.
Somatic variants identified in cfDNA
Next-generation sequencing was performed for cell-free DNA, lymphocyte DNA, and tumor DNA from 21 patients. Mean sequencing depths of ~2700X, ~2800X, and ~1700X were achieved for cell-free DNA, tumor DNA, and lymphocyte DNA, respectively. Comparison of variants detected in tumor and cfDNA with matched lymphocyte DNA identified 59 somatic variants in cfDNA of 10 (48%) patients (Range: 1–15, Median = 4.5). Out of 59 variants, 48 (81.4%) were variants in the coding region, while 11 (18.6%) were detected in the non-coding region of the genes [Figure 2a].
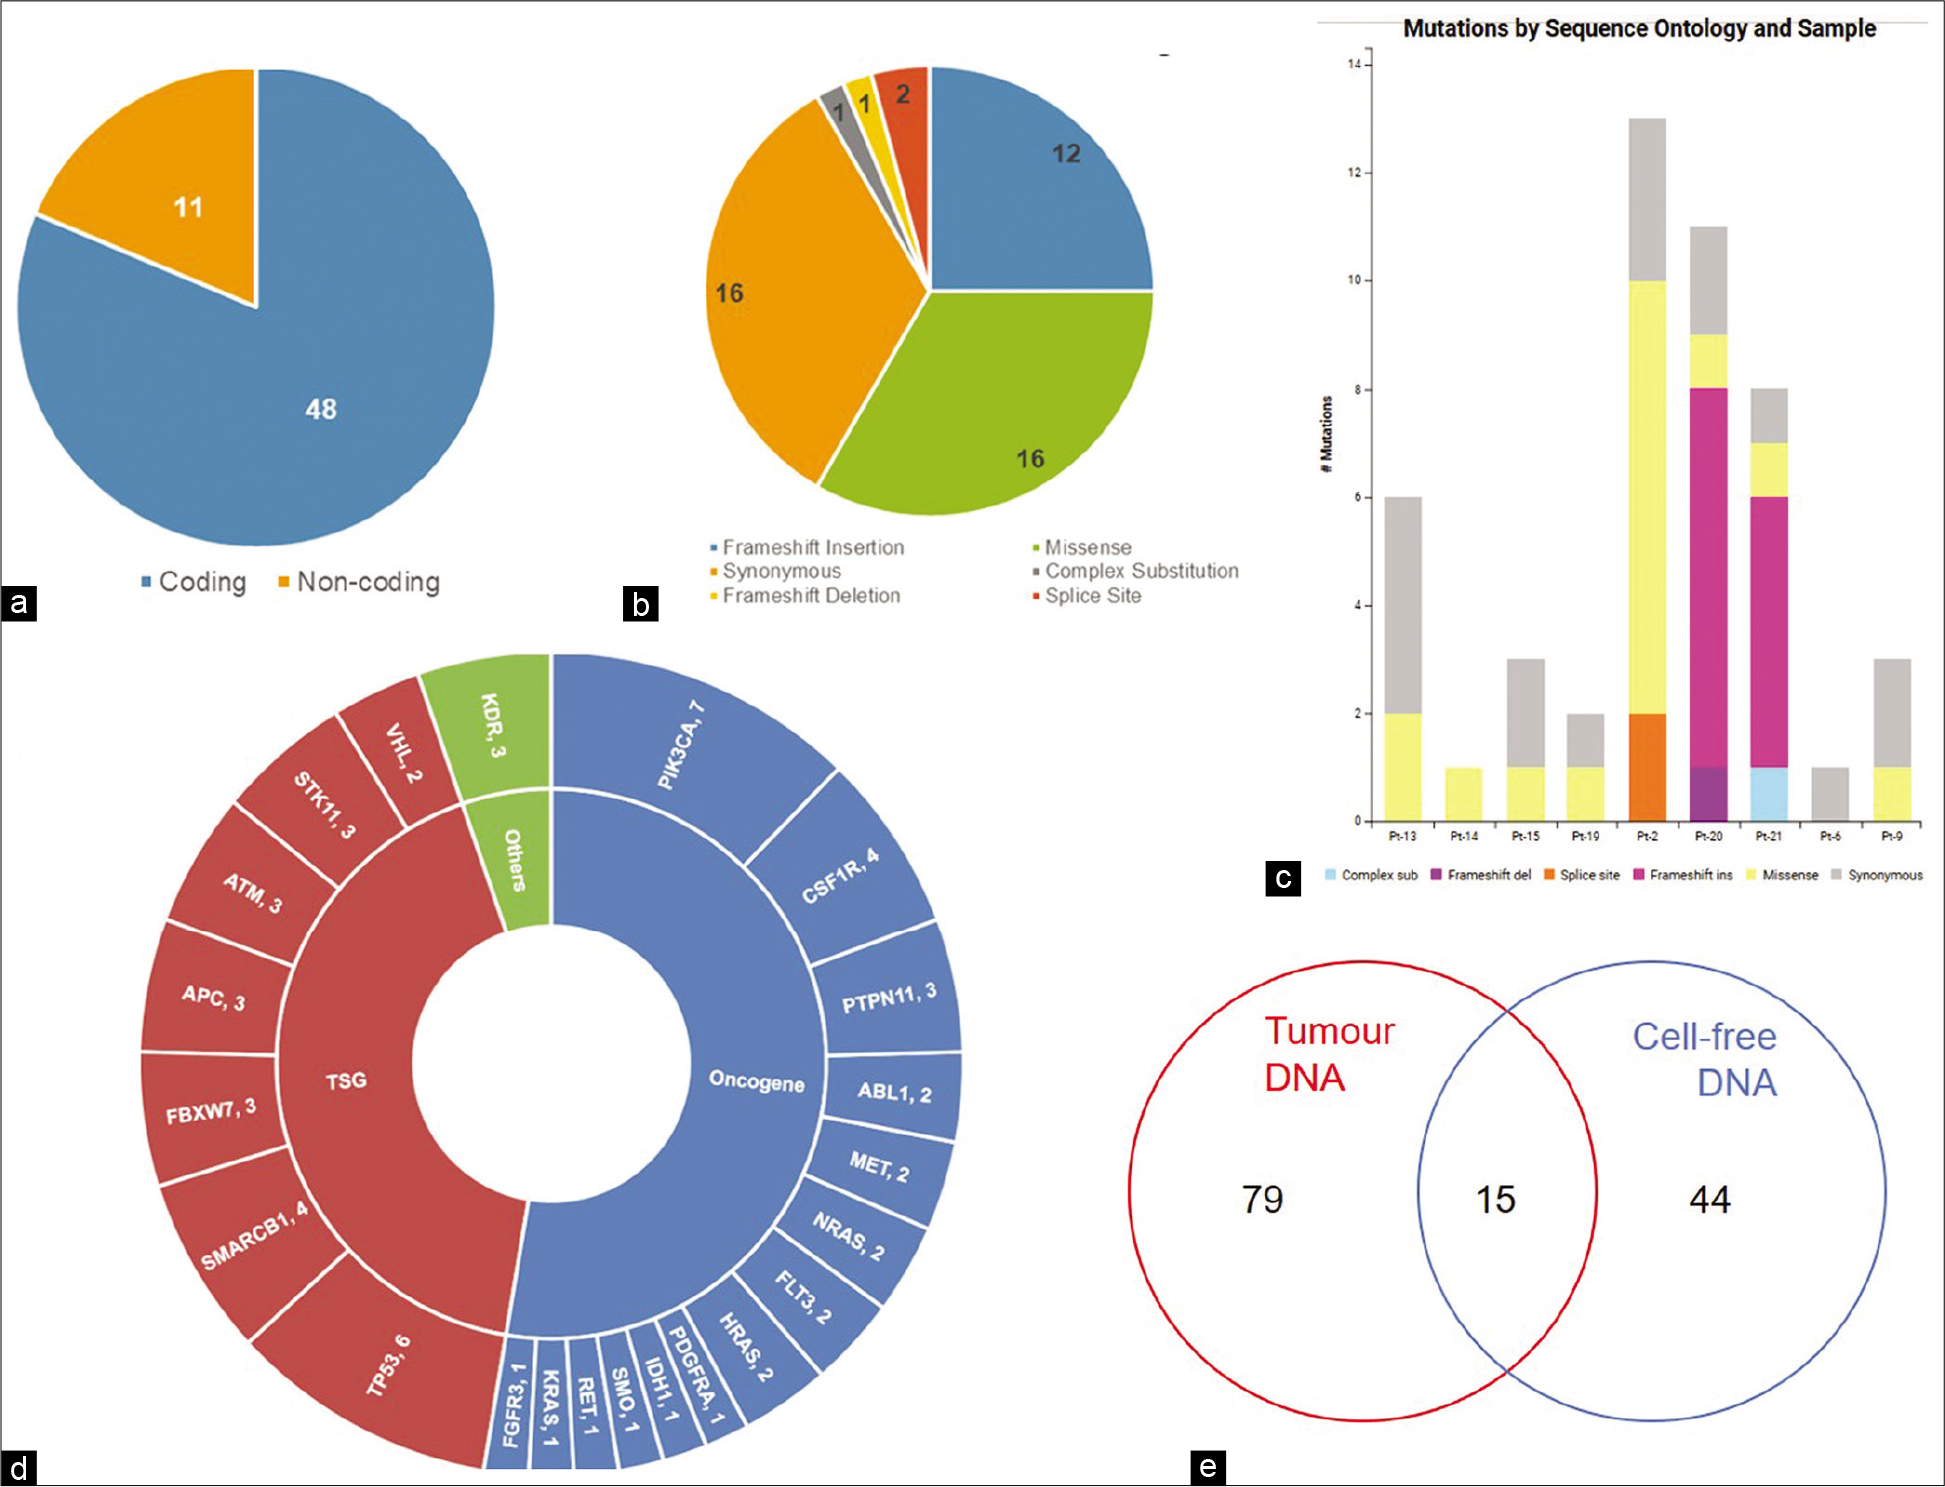
- Somatic variants in cfDNA. (a) Number of coding and non-coding variants, (b) Sequence ontology of variants detected in cfDNA, (c) Sequence ontology of variants detected in cfDNA of each patient, (d) Number of variants in each gene, (e) Concordance of variants between cfDNA and tumor DNA.
A substantial portion of variants consisted of missense (33.3%) and synonymous (33.3%) variants [Figure 2b and c]. Other variants included frameshift insertions (25%), splice site variants (4.2%), frameshift deletion (2.1%), and complex substitution variants (2.1%). Of the 50 genes tested, variants were detected in the coding region of 22 genes, 27 variants being detected in 14 oncogenes, and 19 variants being detected in seven tumor suppressor genes [Figure 2d]. KDR, with two detected somatic variants, was not categorized by CRAVAT as either oncogene or tumor suppressor gene. Notably, PIK3CA was the most frequently mutated gene with seven variants in 5 (50%) patients. Among the tumor suppressor genes, TP53 had the highest number of variants with six variants being detected in three patients (30%) [Figure 2d]. Fourteen variants were reported in COSMIC, with four variants reported in breast cancer and ten variants in other cancers.
Fifteen variants were common to cell-free DNA and tumor DNA [Figure 2e and Table 2]. Of these, three are reported hotspot variants in KRAS, TP53, and PIK3CA [Figure 3a-c]. Seven other variants including five non-coding region variants and one indel have not been reported earlier. The indel was 11bp frameshift deletion which was detected in the ATM gene in a triple negative breast cancer patient, Pt-20 [Figure 3d]. The remaining variants included five synonymous variants and a missense variant, KDR p.Q472H.
| Patient ID | Position | Gene | Ref | Variant | Frequency | Variant ID | Functional effect | Amino Acid Change | Clinical significance | |
|---|---|---|---|---|---|---|---|---|---|---|
| cfDNA | Tumor | |||||||||
| Pt-9 | 4:55962546 | KDR | - | G | 44.2 | 39.1 | rs3214870 | Intron | - | |
| 4:55972974 | KDR | T | A | 48.4 | 46.3 | COSM149673 | Missense | p.Q472H | - | |
| 3:178917005 | PIK3CA | A | G | 51.3 | 42.1 | rs3729674 | Intron | - | ||
| 3:178952020 | PIK3CA | C | T | 51.4 | 39.8 | COSM21451 | Synonymous | p.T1025= | - | |
| 2:209113192 | IDH1 | G | A | 54.1 | 60.7 | rs11554137 | Synonymous | p.G105= | - | |
| Pt-13 | 2:209113192 | IDH1 | G | A | 50.1 | 39.2 | rs11554137 | Synonymous | p.G105= | - |
| Pt-15 | 19:1220321 | STK11 | T | C | 52.8 | 60.9 | rs2075606 | Intron | - | |
| 12:25378561 | KRAS | G | A | 4.3 | 9.6 | COSM19900 | Missense | p.A146V | Pathogenic | |
| 5:112175770 | APC | G | A | 100 | 100 | rs41115 | Synonymous | p.T1493= | Benign | |
| Pt-18 | 5:149433596 | CSF1R | TG | GA | 28.5 | 26.8 | rs2066934 | 3’ UTR | - | |
| 3:178917005 | PIK3CA | A | G | 50.7 | 50.3 | rs3729674 | Intron | - | ||
| Pt-19 | 4:153247278 | FBXW7 | T | C | 4.6 | 4.6 | - | Synonymous | p.Q508= | - |
| Pt-20 | 3:178952085 | PIK3CA | A | G | 3.38 | 64 | COSM94986 | Missense | p.H1047R | Pathogenic |
| 11:108200945 | ATM | ACAGTA AAGGTT |
A | 2 | 46.27 | - | Frameshift Deletion | - | ||
| Pt-21 | 17:7577536 | TP53 | T | C | 0.69 | 32.5 | COSM10668 | Missense | p.R249G | Likely Pathogenic |
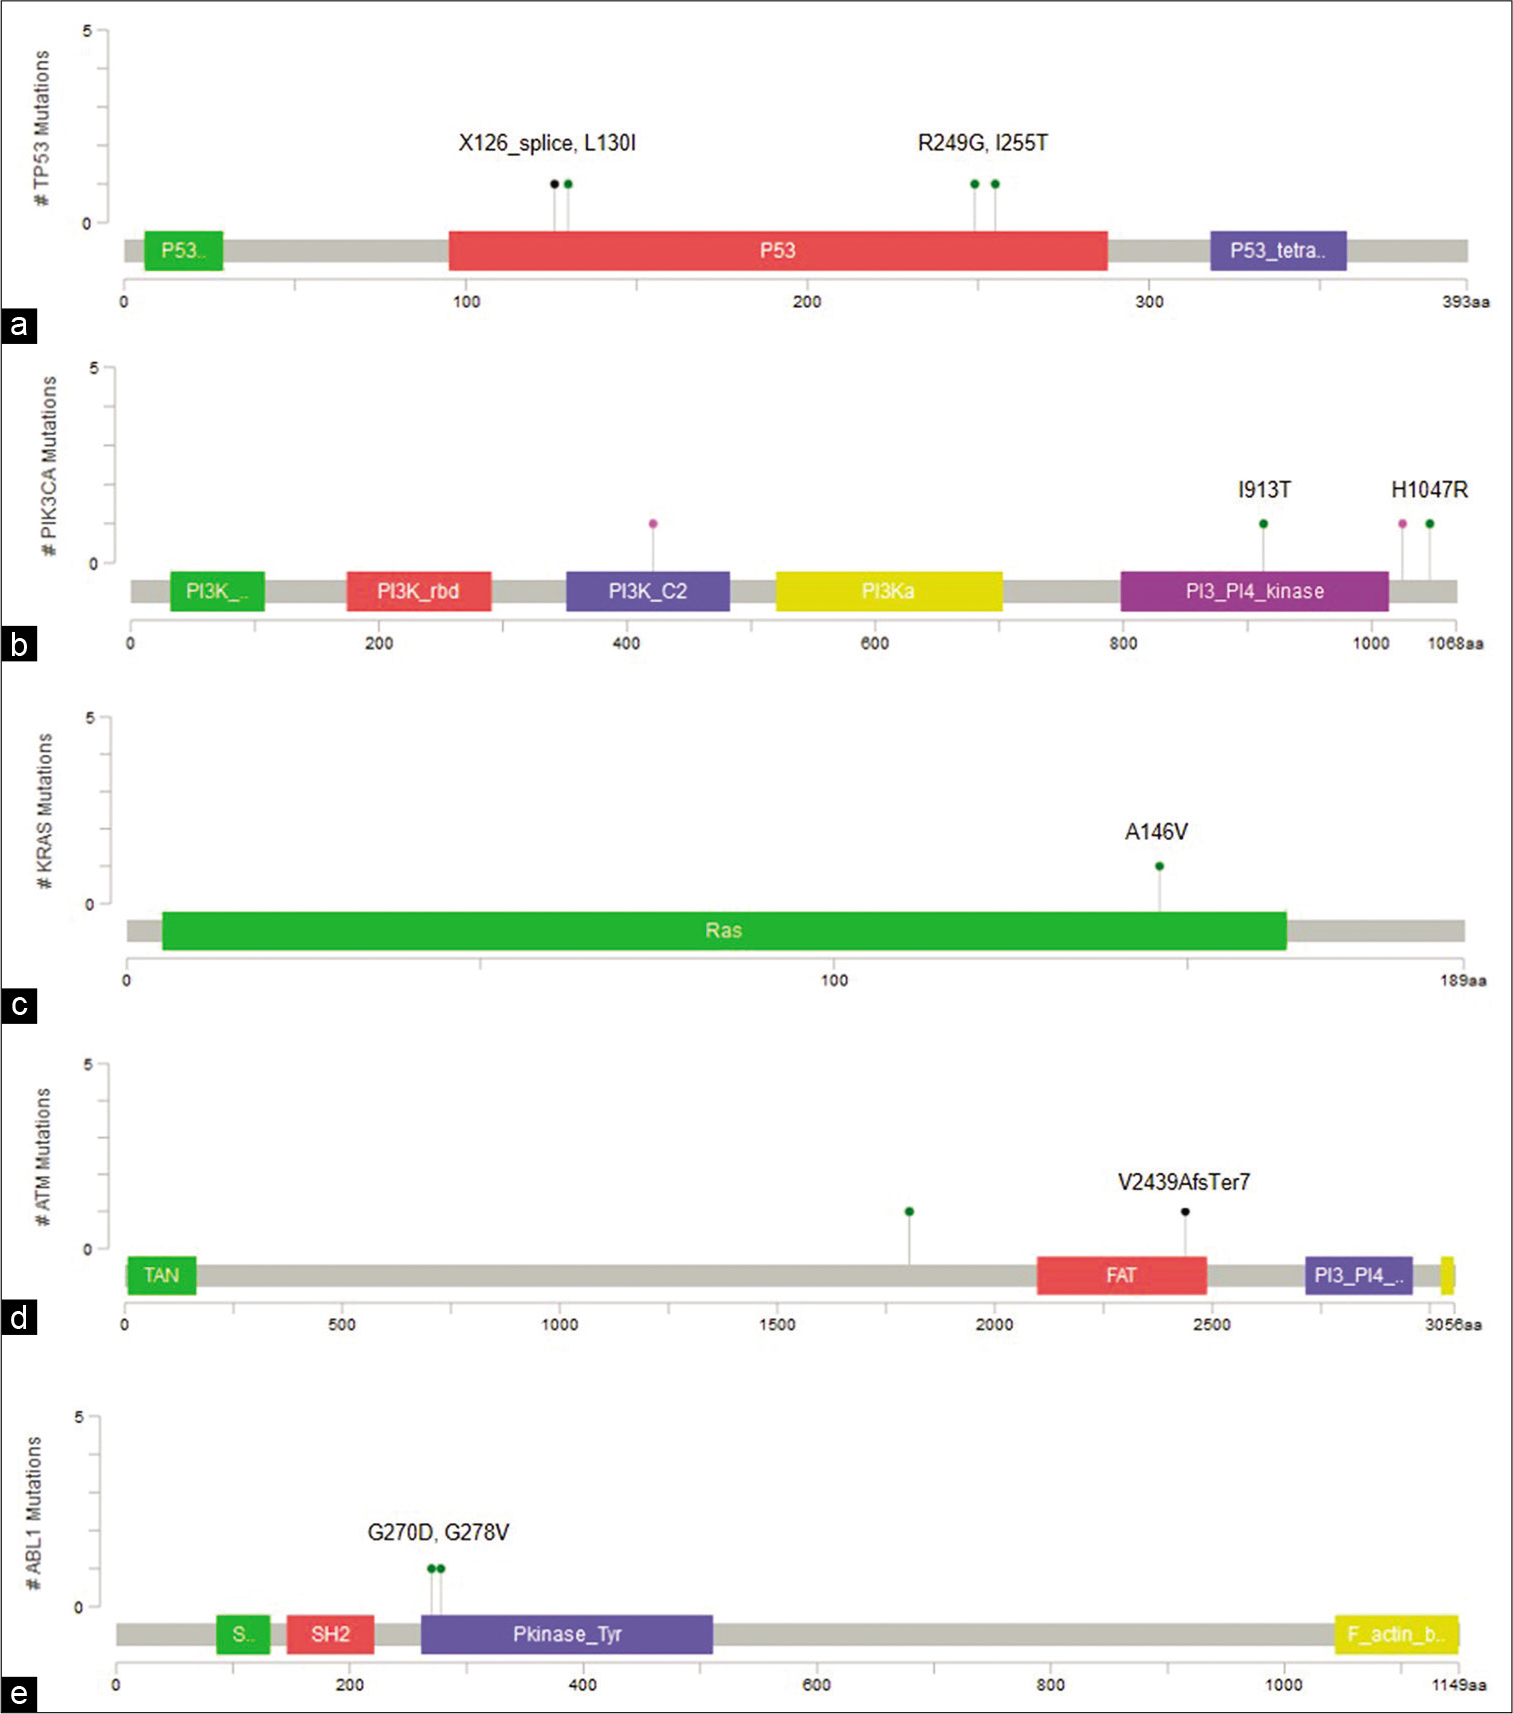
- Visualization of variants in protein coding regions of genes using MutationMapper. (a) TP53 (p.X126_splice, p.L130I,p.R249G, p.I255T), (b) PIK3CA (p.I913T, p.H1047R), (c) KRAS (p.A146V), (d) ATM (p.V2439AfsTer7), (e) ABL1 (p.G270D, p.G278V).
Forty-four variants were unique to cfDNA, including six non-coding variants, 12 frameshift insertions, two splice variants, 13 missense, and 11 synonymous variants [Table 3]. Two TP53 variants, p.I255T and p.L130I are hotspot variants, and along with splice variant g.7578556T>C, were reported to be oncogenic in Oncokb. Three missense variants were predicted to be deleterious by at least two prediction algorithms, including p.G270D and p.G278V in ABL1 and p.I913T in PIK3CA [Figure 3a and e]. In addition, all three variants had high Cancer Driver Scores and VEST pathogenicity scores indicating them to be potential driver mutations.
| Sample ID | Chromosome | Ref | Alt | Gene | Allele Frequency | Sequence ontologya | Protein sequence change |
CHASM | VEST | Mutation Assessor |
SIFT | Poly Phen-2 |
||||
|---|---|---|---|---|---|---|---|---|---|---|---|---|---|---|---|---|
| Score | P-Value | FDR | Score | P-Value | FDR | Impact (Score) | Impact (Score) | Impact (Score) | ||||||||
| Pt-2 | chr9: 133738352 | G | A | ABL1 | 3.96 | MS | p.G270D | 0.94 | 0.0000 | 0.05 | 0.977 | 0.0059 | 0.05 | High (4.34) | Deletrious (0) | Probably damaging (1) |
| Pt-2 | chr9: 133738376 | G | T | ABL1 | 2.46 | MS | p.G278V | 0.898 | 0.0002 | 0.05 | 0.988 | 0.0055 | 0.05 | Medium (2.11) | Deletrious (0) | Probably damaging (1) |
| Pt-21 | chr5: 112176034 | TG | CC | APC | 1.3 | CS | p.A1582P | - | - | - | - | - | - | - | - | - |
| Pt-2 | chr11: 108173668 | A | G | ATM | 0.97 | MS | p.D1803G | 0.494 | 0.1682 | 0.25 | 0.349 | 0.1595 | 0.20 | Low (1.9) | Tolerated (0.14) | Benign (0) |
| Pt-2 | chr11: 108173670 | A | T | ATM | 0.96 | MS | p.I1804F | 0.352 | 0.5037 | 0.55 | 0.09 | 0.6229 | 0.65 | Medium (1.95) | Tolerated (0.67) | Benign (0.04) |
| Pt-2 | chr5: 149453057 | C | T | CSF1R | 1.02 | SS | - | - | - | - | 0.845 | 0.0125 | 0.05 | Medium (2.65) | - | - |
| Pt-9 | chr4: 55972974 | T | A | KDR | 48.4 | MS | p.Q472H (COSM149673) | 0.326 | 0.5838 | 0.65 | 0.102 | 0.5848 | 0.65 | Low (1.63) | Tolerated (0.16) | Benign (0.01) |
| Pt-15 | chr12: 25378561 | G | A | KRAS | 4.3 | MS | p.A146V (COSM19900) | 0.736 | 0.0058 | 0.05 | 0.988 | 0.0055 | 0.05 | Medium (3.06) | Deletrious (0.02) | Possibly damaging (0.88) |
| Pt-2 | chr7: 116339673 | G | A | MET | 8.31 | MS | p.A179T (COSM4384200) | 0.54 | 0.1040 | 0.15 | 0.654 | 0.0321 | 0.05 | Neutral (-0.5) | Tolerated (0.18) | Benign (0) |
| Pt-2 | chr7: 116339682 | G | A | MET | 1.1 | MS | p.A182T | 0.454 | 0.2423 | 0.30 | 0.092 | 0.6164 | 0.65 | Neutral (-1.49) | Tolerated (1) | Benign (0) |
| Pt-2 | chr3: 178947863 | T | C | PIK3CA | 0.73 | MS | p.I913T | 0.842 | 0.0006 | 0.05 | 0.984 | 0.0057 | 0.05 | High (3.92) | Deletrious (0) | Probably damaging (1) |
| Pt-20 | chr3: 178952085 | A | G | PIK3CA | 3.38 | MS | p.H1047R (COSM775) | 0.976 | 0.0000 | 0.05 | 0.882 | 0.0097 | 0.05 | Neutral (0.6) | Tolerated (0.11) | Benign (0.09) |
| Pt-20 | chr12: 112926959 | C | T | PTPN11 | 54.8 | MS | p.R527C (COSM935284) | 0.314 | 0.6229 | 0.65 | 0.67 | 0.0295 | 0.05 | Low (1.67) | Deletrious (0) | Benign (0.03) |
| Pt-13 | chr22: | C | A | SMA | 11.7 | MS | p.T72K | 0.416 | 0.3275 | 0.40 | 0.426 | 0.10640.1064 | 0.15 | Neutral | Neutral | Benign (0.01) |
| Pt-19 | 24134064 | RCB1 | 15.1 | (0.34) | (0.31) | |||||||||||
| Pt-2 | chr17: 7578556 | T | A | TP53 | 15.16 | SS | - | - | - | - | 0.961 | 0.0064 | 0.05 | - | - | - |
| Pt-2 | chr17: 7578542 | G | T | TP53 | 0.98 | MS | p.L130I | 0.666 | 0.0198 | 0.05 | 0.786 | 0.0160 | 0.05 | Medium (2.94) | Deletrious (0) | Probably damaging (1) |
| Pt-21 | chr17: 7577536 | T | C | TP53 | 0.69 | MS | p.R249G (COSM10668) | 0.83 | 0.0006 | 0.05 | 0.97 | 0.0061 | 0.05 | Medium (3.31) | Deletrious (0) | Probably damaging (0.99) |
| Pt-13 | chr17: 7577517 | A | G | TP53 | 6.4 | MS | p.I255T (COSM11181) | 0.84 | 0.0006 | 0.05 | 0.888 | 0.0094 | 0.05 | Medium (2.83) | Deletrious (0) | Probably damaging (0.99) |
The remaining eight variants were predicted to have benign effect by at least two prediction algorithms and also had low CHASM and VEST scores. Among the frameshift insertions, ten frameshift insertions were predicted to have a damaging effect while two were predicted to be neutral by SIFT-INDEL tool [Table 4]. Interestingly, all the frameshift insertion variants occurred in the triple-negative breast cancer patients.
| Sample ID | Chromosome | Position | Ref | Alt. | Gene | Allele Frequency | Protein change | VEST | SIFT | ||||
|---|---|---|---|---|---|---|---|---|---|---|---|---|---|
| Score | P-value | FDR | Effect | Confidence Score | Indelocatio | ||||||||
| Pt-20 | chr11 | 534239 | - | A | HRAS | 0.297 | p.(V29CfsTer19) | 0.766 | 0.0017 | 0.05 | Damaging | 0.858 | 15% |
| Pt-20 | chr11 | 534239 | - | G | HRAS | 0.296 | p.(V29CfsTer19) | 0.766 | 0.0017 | 0.05 | Damaging | 0.858 | 15% |
| Pt-20 | chr19 | 1220485 | - | C | STK11 | 1.62 | p.(D194RfsTer72) | 0.933 | 0.00026 | 0.05 | Damaging | 0.858 | 44% |
| Pt-20 | chr4 | 1808887 | - | C | FGFR3 | 7.6 | p.(Q777PfsTer42) | 0.58 | 0.005 | 0.05 | Neutral | 0.787 | 96% |
| Pt-21 | chr13 | 28608275 | - | A | FLT3 | 1.3 | p.(R595QfsTer4) | 0.868 | 0.00048 | 0.05 | Damaging | 0.858 | 60% |
| Pt-20 | chr13 | 28610131 | - | A | FLT3 | 0.8 | p.(S454FfsTer32) | 0.848 | 0.00037 | 0.05 | Damaging | 0.858 | 46% |
| Pt-21 | chr10 | 43609078 | - | T | RET | 0.73 | p.(E614Ter) | 0.858 | 0.00040 | 0.05 | Damaging | 0.858 | 57% |
| Pt-21 | chr4 | 55972974 | - | A | KDR | 50.1 | p.(A473CfsTer11) | 0.502 | 0.0102 | 0.05 | Damaging | 0.529 | 35% |
| Pt-20 | chr11 | 108200946 | CAGTAA AGGTT |
- | ATM | 2 | p.(V2439AfsTer7) | 0.954 | 0.00023 | 0.05 | Damaging | 0.529 | 80% |
| Pt-20 | chr12 | 112926947 | - | A | PTPN11 | 0.45 | p.(T524NfsTer7) | 0.909 | 0.00026 | 0.05 | Damaging | 0.858 | 88% |
| Pt-21 | chr12 | 112926948 | - | A | PTPN11 | 4.1 | p.(T524NfsTer7) | 0.909 | 0.00026 | 0.05 | Damaging | 0.858 | 88% |
| Pt-20 | chr7 | 128846340 | - | G | SMO | 0.38 | p.(Y394LfsTer46) | 0.855 | 0.00034 | 0.05 | Neutral | 0.961 | 50% |
| Pt-21 | chr3 | 178916867 | - | A | PIK3CA | 1.24 | p.(T86NfsTer6) | 0.884 | 0.00048 | 0.05 | Damaging | 0.579 | 8% |
Validation of pathogenic somatic variants
Sanger sequencing was done to validate pathogenic variants PIK3CA p.H1047R (Pt-20) and KRAS p.A146V (Pt-15) and frameshift insertions, PIK3CA p.(T86NfsTer6) (Pt-21) and STK11 p.(D194RfsTer72) (Pt-20), respectively. PIK3CA p.H1047R was detected in tumor DNA of patient Pt-21 [Figure 4]. However, none of the variants were detected in cell-free DNA [Figure 4].
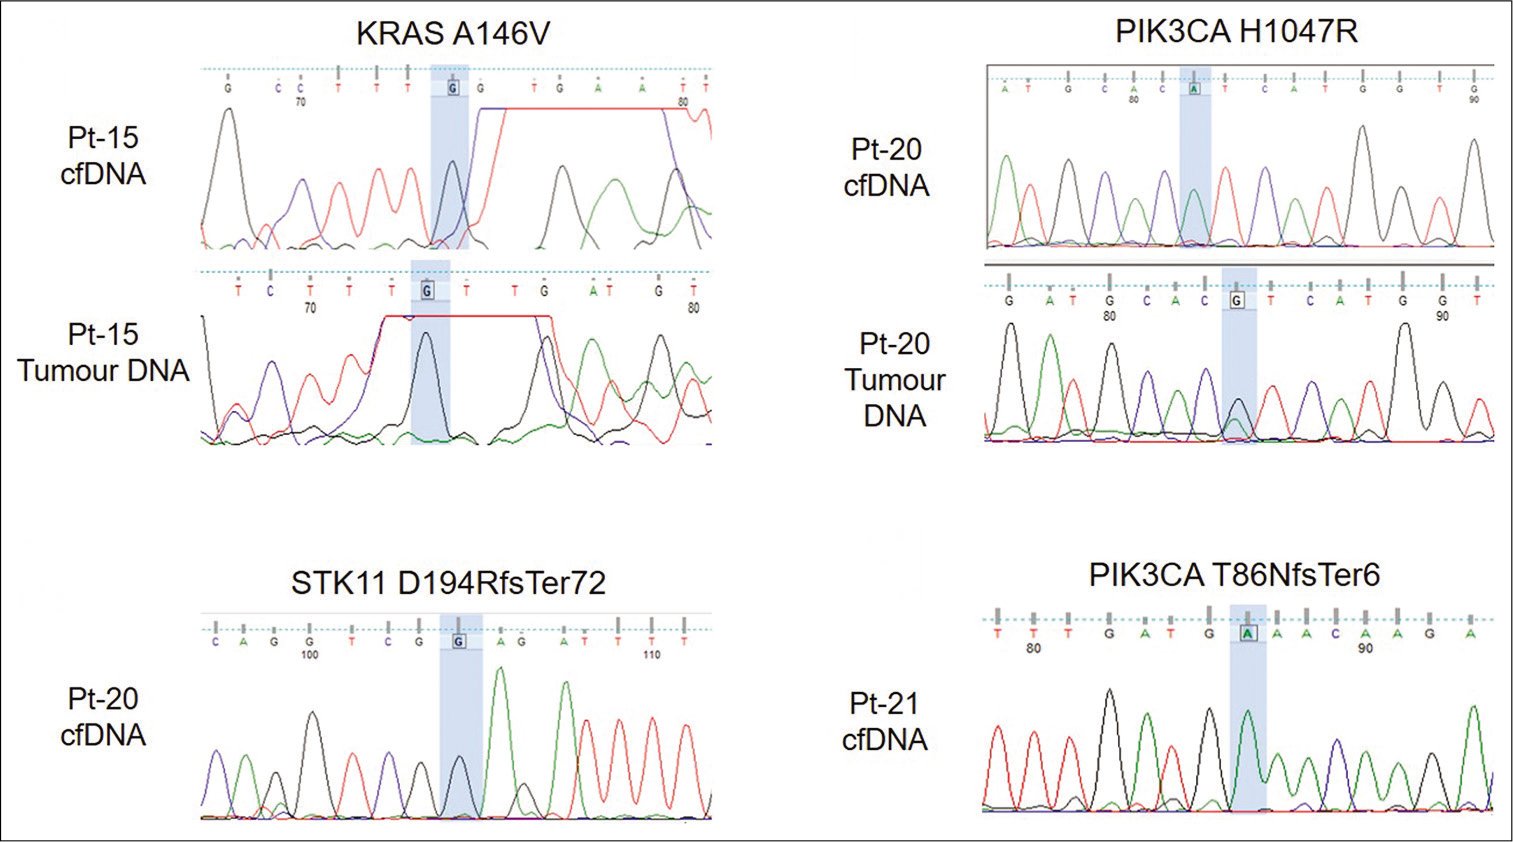
- Electropherogram showing validation of variants using Sanger sequencing. Variant location is highlighted in blue.
DISCUSSION
Development of new mutations during the course of treatment presents a difficulty for clinical management when tumor tissue cannot be obtained for genetic study. Use of cfDNA represents relatively a less invasive mode of tracking the changes in tumor genetic profile.[11] It has been evaluated by many studies for use at different stages of therapy as an efficient method for breast cancer prognostication.[8,10]
This study is a preliminary attempt to identify somatic variants in cfDNA of breast cancer patients using NGS. The concentration of cfDNA did not correlate with clinicopathological features such as age, stage, ER, PR, or HER2 status. This is in contrast to other studies where cfDNA concentration correlated with disease stage and hormone status.[20,21] This difference may be due to the small sample size used in our study. Exclusion of germline variants identified ten patients with somatic variants in cfDNA, with 15 out of 59 variants being concordant between cfDNA and matched tumor DNA. The mean variant concordance among the ten patients was 36.5% (Median = 14.6%, Range: 0–100). Three known hotspot variants in TP53, PIK3CA, and KRAS were among the variants concordant between cfDNA and tumor DNA. Two other hotspot variants in TP53 were unique to cfDNA. cfDNA variants being undetected in tumor DNA can result from the variants originating from a part of tumor not sampled by tissue biopsy or from metastatic tumors. Rothé et al. also detected variants unique to cfDNA as well as those unique to tumor DNA.[11] Furthermore, low variant allele frequency may prevent variants in cfDNA from being detected further contributing to discordant results. Similar results have been reported in earlier studies. Guo et al. reported a concordance rate of 54.6% in early-stage and 80% in advanced stage NSCLC.[22] Similar discordant results were also observed by Mehrotra et al.[23]
PIK3CA mutations are reported to occur in 30% of breast cancer cases and play an important role in breast tumorigenesis. The presence of PIK3CA mutations in cfDNA was confirmed in several studies.[24-26] In a recent study by Kodahl et al., serum cfDNA mutations correlated with response to treatment.[25] In our study, PIK3CA variants were detected in 5/10 (50 %) patients. p.H1047R, a known pathogenic mutation in PIK3CA, was detected in both cfDNA and tumor DNA in patient Pt-21. Validation by Sanger sequencing revealed the presence of this mutation in tumor DNA alone but not in cfDNA [Figure 4]. This may be due to the variant frequency being below the detection limit of Sanger sequencing. PIK3CA p.I913T was detected in Pt-2, a 35 year old breast cancer patient with bone metastasis but the clinical significance of this variant has not been reported previously. This patient also had a hotspot p.L130I variant in TP53 and two potentially deleterious missense variants, p.G270D and p.G278V in ABL1. While p.G270D has been reported earlier in chronic myeloid leukemia,[27] the effect of both these variants on ABL1 protein function is unknown.
KRAS mutations are reported infrequently (~5%) in breast cancers.[28,29] A known pathogenic variant KRAS p.A146V was detected in a 79 year old invasive lobular carcinoma patient (Pt-15) with liver metastasis, in both cell-free DNA and tumor DNA [Table 3]. This variant is common in colorectal and pancreatic cancers[28] and has been reported in circulation by several studies in both cancers.[30-33] However, p.A146V was not detected by Sanger sequencing in both cell-free DNA as well as tumor DNA in this study. This may be due to allele frequency being lower than the detection limit of Sanger sequencing. Pt-15 also possessed a p.T79fs mutation in the CDH1 gene in tumor DNA. CDH1 mutations are known to be common in invasive lobular carcinoma (ILC) with loss of CDH1 being a hallmark of ILC.[34,35] However, this mutation was undetected in cfDNA.
Thirteen frameshift indels were detected in cfDNA and all of these were detected in two patients, Pt-20 and Pt-21. Both patients were diagnosed with Stage 3 triple negative breast cancer. Pt-20 had seven frameshift insertions and one frameshift deletion in the ATM gene. Five frameshift insertions were detected in Pt-21. Surprisingly, although frameshift indels were detected in both patients, they responded differently to treatment. Pt-20 developed local disease progression during treatment while Pt-21 responded to treatment and remained asymptomatic. We validated two frameshift indels PIK3CA p.(T86NfsTer6) (Pt-21) and STK11 p.(D194RfsTer72) (Pt-20) but they were not detected by Sanger sequencing in cfDNA. No frameshift indel was detected in the other subtypes.
This research is subject to certain limitations. First, this study was performed in a small number of patients. Second, the validation of variants was performed using Sanger sequencing which has a detection limit of 15–20%. Furthermore, variants were not filtered on the basis of allele frequency to avoid missing any potentially pathogenic variants that may be present at low frequencies. Hence, majority of the pathogenic variants detected in this study are below a mutant allele fraction of 15%, thereby becoming unamenable to validation by Sanger sequencing technique. Third, monitoring of certain pathogenic variants in follow-up samples during treatment would have revealed changes in mutant allele fraction in response to treatment, thus further evaluating the use of cell-free DNA as a non-invasive biomarker for breast cancer.
Nonetheless, our study has identified 16 variants which have not been reported previously, of which 14 variants were predicted to have a pathogenic effect. Examination of the effect of these variants on protein function and their role in breast cancer can be performed by future studies. These variants can also be evaluated for applications as noninvasive biomarkers for breast cancer.
CONCLUSION
In this study, we report 59 detectable somatic variants in cfDNA of breast cancer patients. We found that the cfDNA variants detected in seven patients were also detected in the breast tumor tissue. Out of the 59 total variants detected in cfDNA, five hotspot variants were detected in TP53, PIK3CA, and KRAS. The remaining unique variants were evaluated for clinical significance and 14 cfDNA variants were predicted to be potentially pathogenic. The variants reported in this study may have high potential in the liquid biopsy-based diagnosis of breast cancer. Further, quantitative follow-up of these variants in post-treatment samples can be valuable in noninvasive breast cancer prognosis.
Declaration of patient consent
The authors certify that they have obtained all appropriate patient consent.
Financial support and sponsorship
This study was supported by The Terry Fox Foundation, Canada.
Conflicts of interest
There are no conflicts of interest.
References
- Global cancer statistics 2018: GLOBOCAN estimates of incidence and mortality worldwide for 36 cancers in 185 countries. CA Cancer J Clin. 2018;68:394-424.
- [CrossRef] [PubMed] [Google Scholar]
- Global Cancer Observatory: Cancer Today. 2018. Lyon, France: International Agency for Research on Cancer; Available from: http://www.gco.iarc.fr/today/home [Last accessed on 2018 Nov 19]
- [Google Scholar]
- Biological subtypes of breast cancer: Prognostic and therapeutic implications. World J Clin Oncol. 2014;5:412-24.
- [CrossRef] [PubMed] [Google Scholar]
- Overview on clinical relevance of intra-tumor heterogeneity. Front Med. 2018;5:85.
- [CrossRef] [PubMed] [Google Scholar]
- Molecular heterogeneity in breast cancer: State of the science and implications for patient care. Semin Cell Dev Biol. 2017;64:65-72.
- [CrossRef] [PubMed] [Google Scholar]
- Role of circulating cell-free DNA in cancers. Mol Diagn Ther. 2015;19:339-50.
- [CrossRef] [PubMed] [Google Scholar]
- Circulating cell-free tumor DNA analysis of 50 genes by next-generation sequencing in the prospective MOSCATO trial. Clin Cancer Res. 2016;22:2960-8.
- [CrossRef] [PubMed] [Google Scholar]
- The state of the art in prediction of breast cancer relapse using cell-free circulating tumor DNA liquid biopsies. Ann Transl Med. 2016;4:S68.
- [CrossRef] [PubMed] [Google Scholar]
- Correlation between PIK3CA mutations in cell-free DNA and everolimus efficacy in HR+, HER2-advanced breast cancer: Results from BOLERO-2. Br J Cancer. 2017;116:726-30.
- [CrossRef] [PubMed] [Google Scholar]
- Rapid changes in circulating tumor DNA in serially sampled plasma during treatment of breast cancer: A case report. Am J Case Rep. 2017;18:26-32.
- [CrossRef] [PubMed] [Google Scholar]
- Plasma circulating tumor DNA as an alternative to metastatic biopsies for mutational analysis in breast cancer. Ann Oncol. 2014;25:1959-65.
- [CrossRef] [PubMed] [Google Scholar]
- Highly sensitive detection of ESR1 mutations in cell-free DNA from patients with metastatic breast cancer using molecular barcode sequencing. Breast Cancer Res Treat. 2018;167:49-58.
- [CrossRef] [PubMed] [Google Scholar]
- Molecular barcode sequencing of the whole ligand binding domain of the ESR1 gene in cell-free DNA from patients with metastatic breast cancer. Trans Oncol. 2020;13:100735.
- [CrossRef] [PubMed] [Google Scholar]
- CRAVAT: Cancer-related analysis of variants toolkit. Bioinformatics. 2013;29:647-8.
- [CrossRef] [PubMed] [Google Scholar]
- Identifying mendelian disease genes with the variant effect scoring tool. BMC Genomics. 2013;14:S3.
- [CrossRef] [PubMed] [Google Scholar]
- Assessing the pathogenicity of insertion and deletion variants with the variant effect scoring tool (VEST-Indel) Hum Mutat. 2016;37:28-35.
- [CrossRef] [PubMed] [Google Scholar]
- Cancer-specific high-throughput annotation of somatic mutations: Computational prediction of driver missense mutations. Cancer Res. 2009;69:6660-7.
- [CrossRef] [PubMed] [Google Scholar]
- The cBio cancer genomics portal: An open platform for exploring multidimensional cancer genomics data. Cancer Discov. 2012;2:401-4.
- [CrossRef] [PubMed] [Google Scholar]
- SIFT web server: Predicting effects of amino acid substitutions on proteins. Nucleic Acids Res. 2012;40:W452-7.
- [CrossRef] [PubMed] [Google Scholar]
- The plasma DNA concentration as a potential breast cancer screening marker. Indian J Clin Biochem. 2015;30:55-8.
- [CrossRef] [PubMed] [Google Scholar]
- The presence of disseminated tumour cells in the bone marrow is inversely related to circulating free DNA in plasma in breast cancer dormancy. Br J Cancer. 2012;106:375-82.
- [CrossRef] [PubMed] [Google Scholar]
- Heterogeneous mutation pattern in tumor tissue and circulating tumor DNA warrants parallel NGS panel testing. Mol Cancer. 2018;17:131.
- [CrossRef] [PubMed] [Google Scholar]
- Detection of somatic mutations in cell-free DNA in plasma and correlation with overall survival in patients with solid tumors. Oncotarget. 2017;9:10259-71.
- [CrossRef] [PubMed] [Google Scholar]
- Detection of PIK3CA mutations in circulating free DNA in patients with breast cancer. Breast Cancer Res Treat. 2010;120:461-7.
- [CrossRef] [PubMed] [Google Scholar]
- Correlation between circulating cell-free PIK3CA tumor DNA levels and treatment response in patients with PIK3CA-mutated metastatic breast cancer. Mol Oncol. 2018;12:925-35.
- [CrossRef] [PubMed] [Google Scholar]
- PIK3CA mutations in serum DNA are predictive of recurrence in primary breast cancer patients. Breast Cancer Res Treat. 2015;150:299-307.
- [CrossRef] [PubMed] [Google Scholar]
- A half-log increase in BCR-ABL RNA predicts a higher risk of relapse in patients with chronic myeloid leukemia with an imatinib-induced complete cytogenetic response. Clin Cancer Res. 2007;13:6136-43.
- [CrossRef] [PubMed] [Google Scholar]
- Ras oncogenes: Split personalities. Nat Rev Mol Cell Biol. 2008;9:517-31.
- [CrossRef] [PubMed] [Google Scholar]
- Lack of evidence for KRAS oncogenic mutations in triple-negative breast cancer. BMC Cancer. 2010;10:136.
- [CrossRef] [PubMed] [Google Scholar]
- Treatment monitoring in metastatic colorectal cancer patients by quantification and KRAS genotyping of circulating cell-free DNA. PLoS One. 2017;12:e0174308.
- [CrossRef] [PubMed] [Google Scholar]
- Liquid biopsy in colon cancer: Comparison of different circulating DNA extraction systems following absolute quantification of KRAS mutations using intplex allele-specific PCR. Oncotarget. 2017;8:86253-63.
- [CrossRef] [PubMed] [Google Scholar]
- Circulating cell-free DNA from colorectal cancer patients may reveal high KRAS or BRAF mutation load. Transl Oncol. 2013;6:319-28.
- [CrossRef] [PubMed] [Google Scholar]
- KRAS mutations in cell-free DNA from preoperative and postoperative sera as a pancreatic cancer marker: A retrospective study. Br J Cancer. 2018;118:662-9.
- [CrossRef] [PubMed] [Google Scholar]
- Comprehensive molecular portraits of invasive lobular breast cancer. Cell. 2015;163:506-19.
- [CrossRef] [PubMed] [Google Scholar]
- Cancer Genome Atlas Network, Comprehensive molecular portraits of human breast tumors. Nature. 2012;490:61-70.
- [CrossRef] [PubMed] [Google Scholar]


